03AB InBev2019 · 2021
BEES
From order taking to revenue protection
From
To
Revenue protection at each point of sale.
- Role
- Scope
- Team
- Period
Current state
Context, problem and intervention
Context
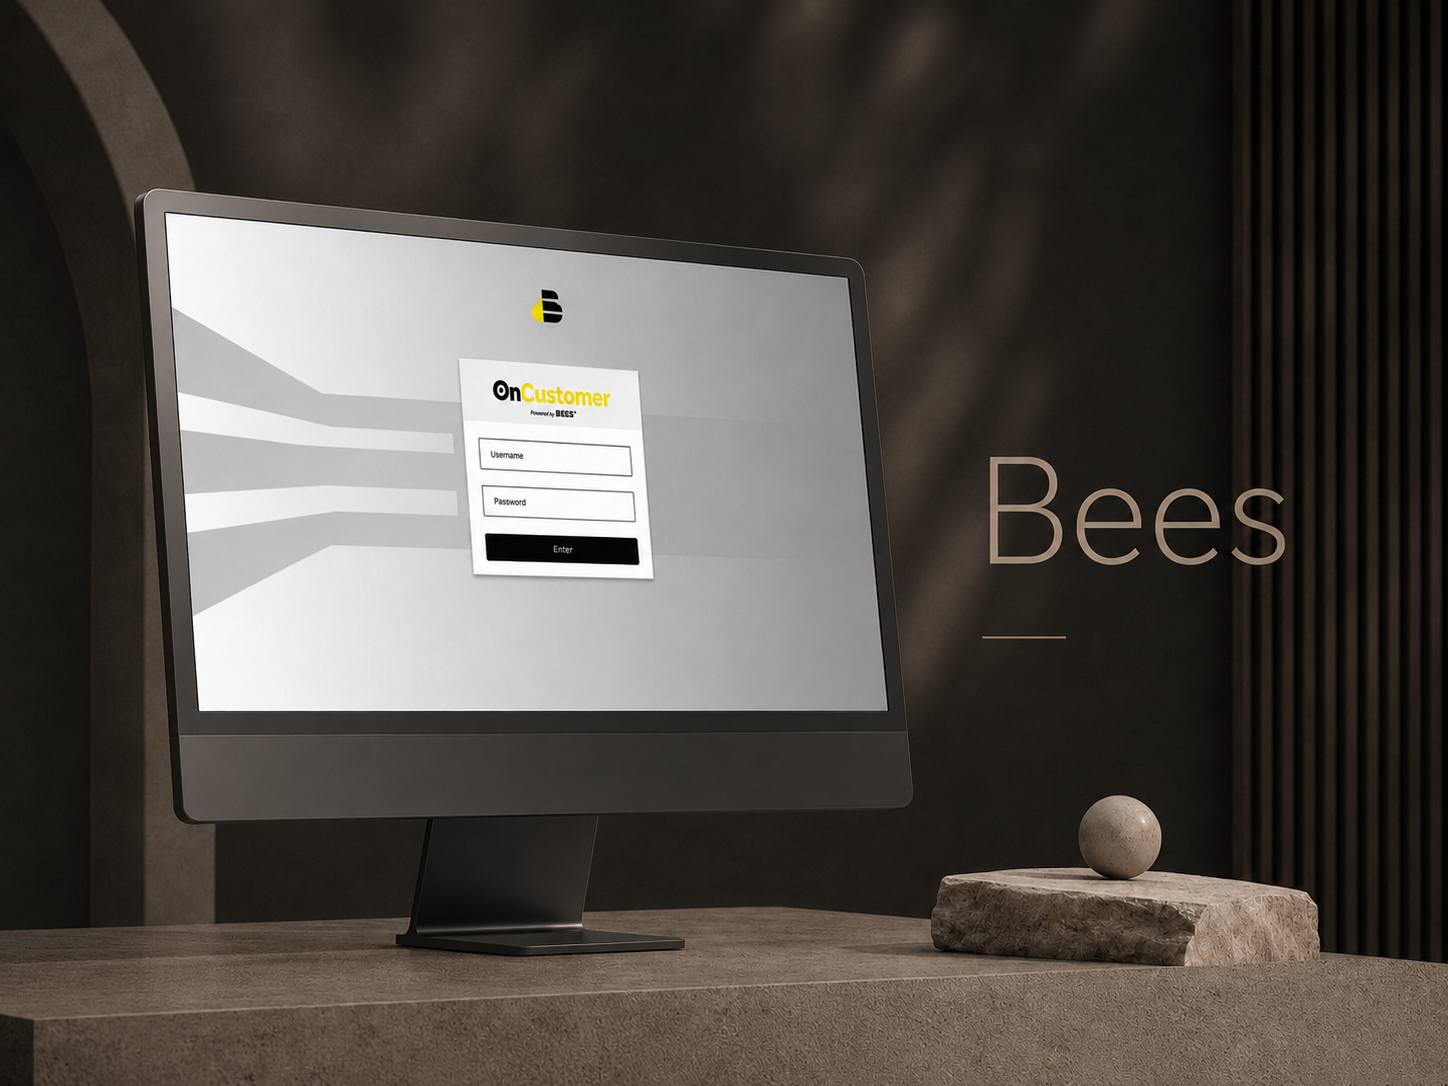
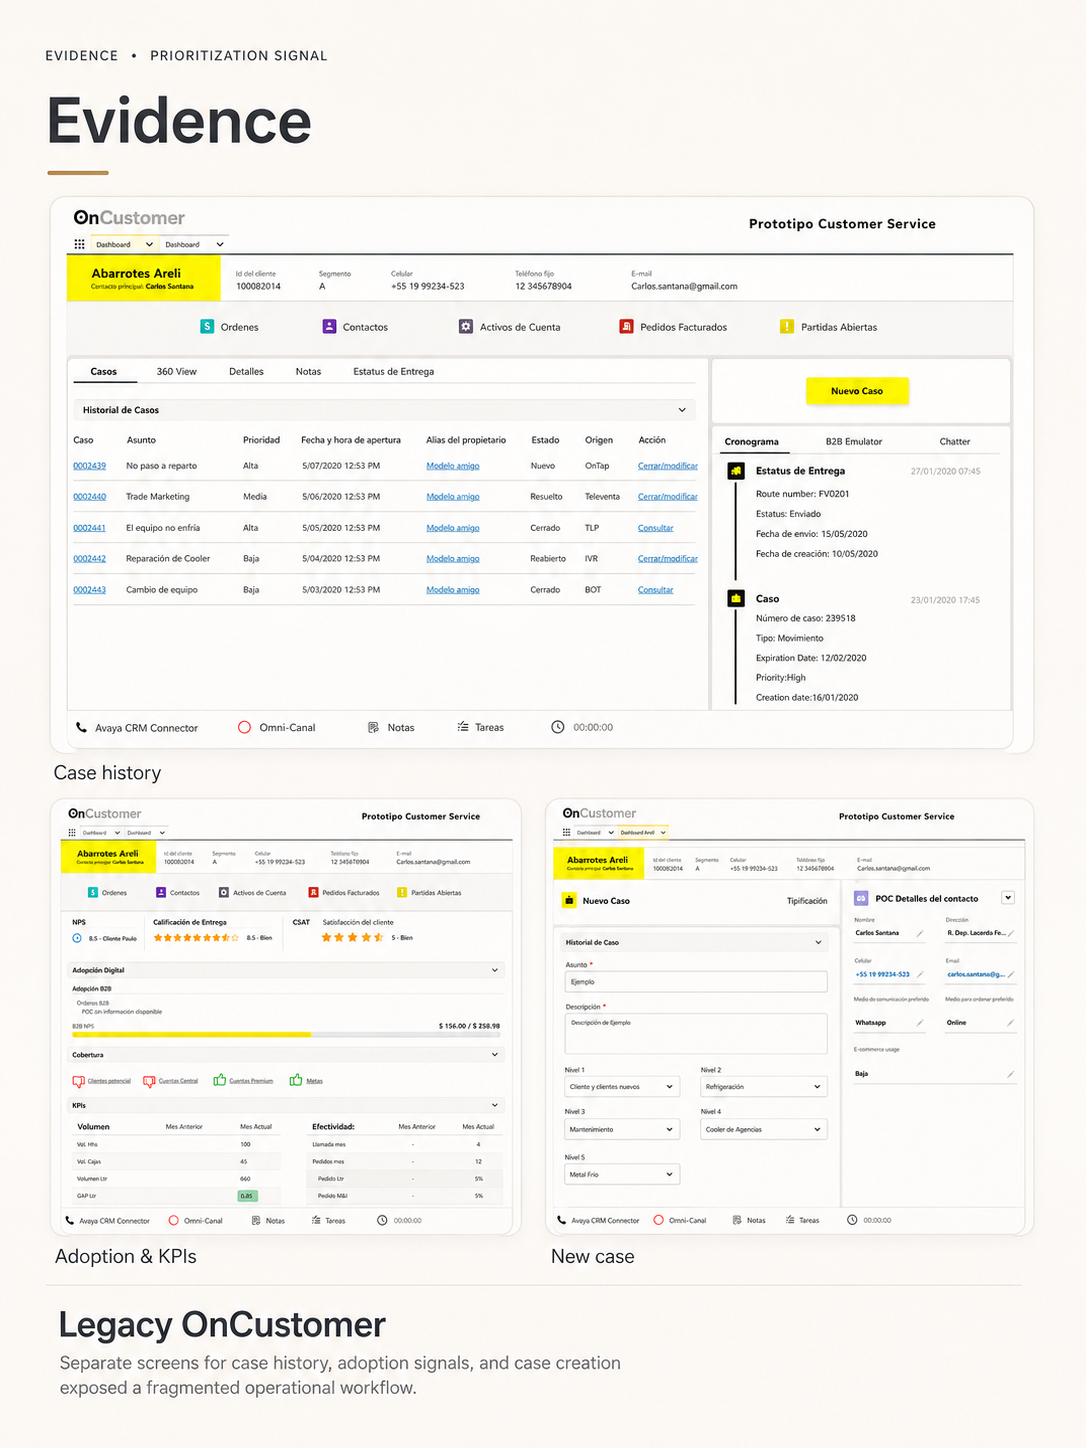
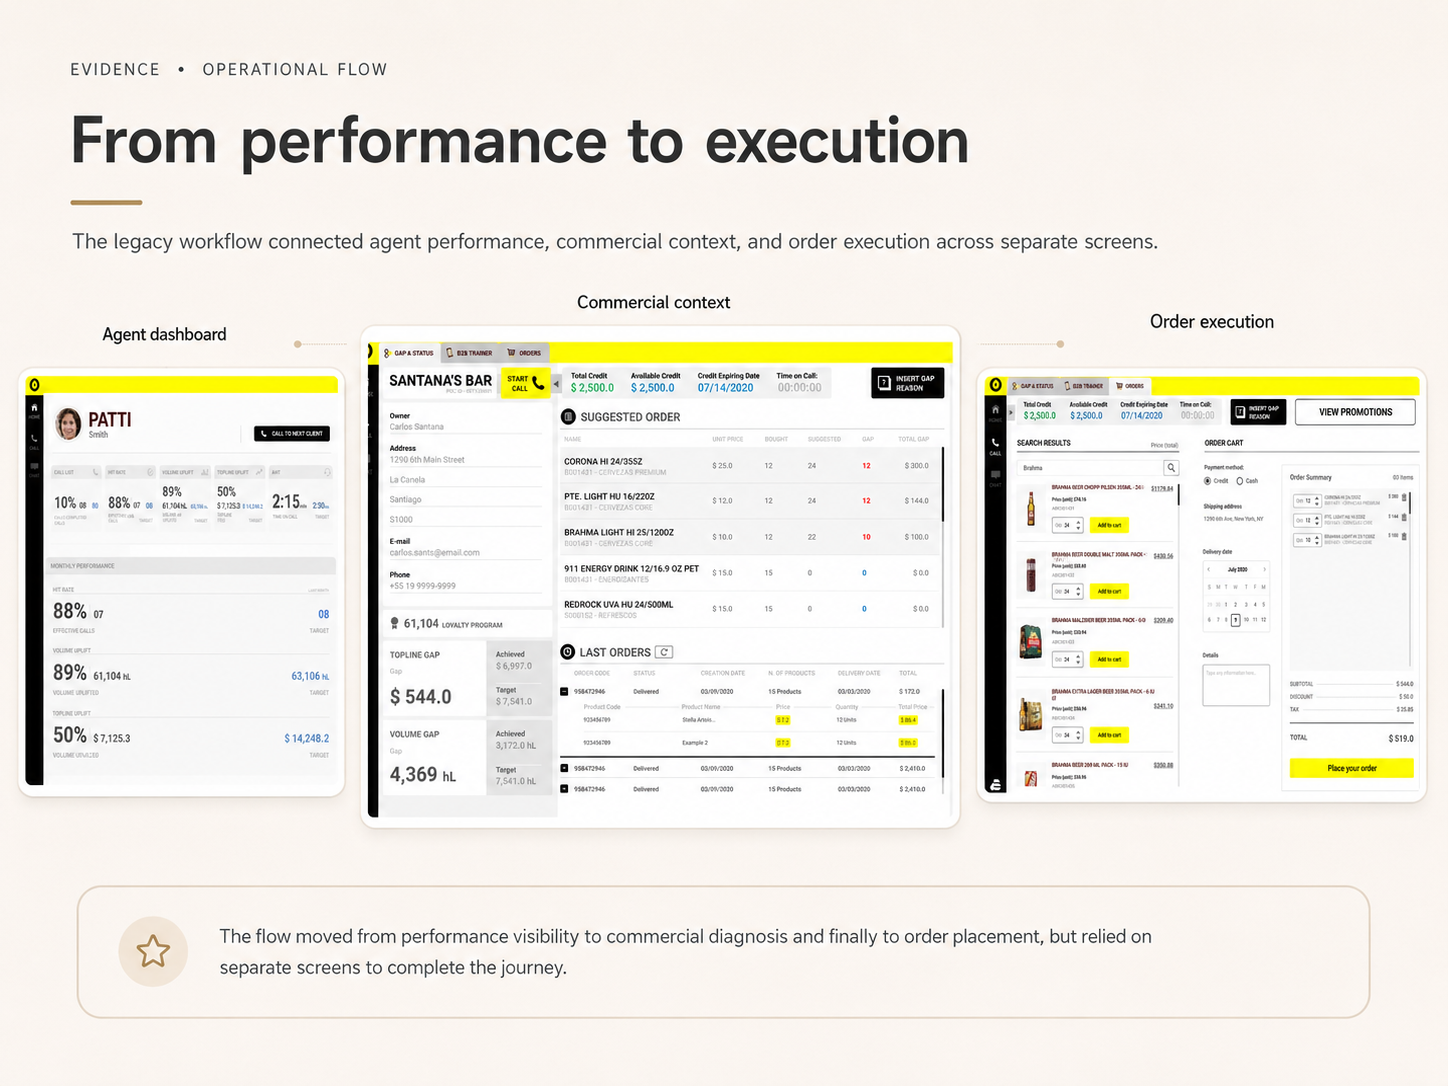
BEES is AB InBev's B2B platform for the bars, restaurants and small retailers that buy its products. Sales agents visit these points of sale, review how each account is performing and agree on what to order next. OnCustomer was the agent-facing product being replaced by BEES.
Problem
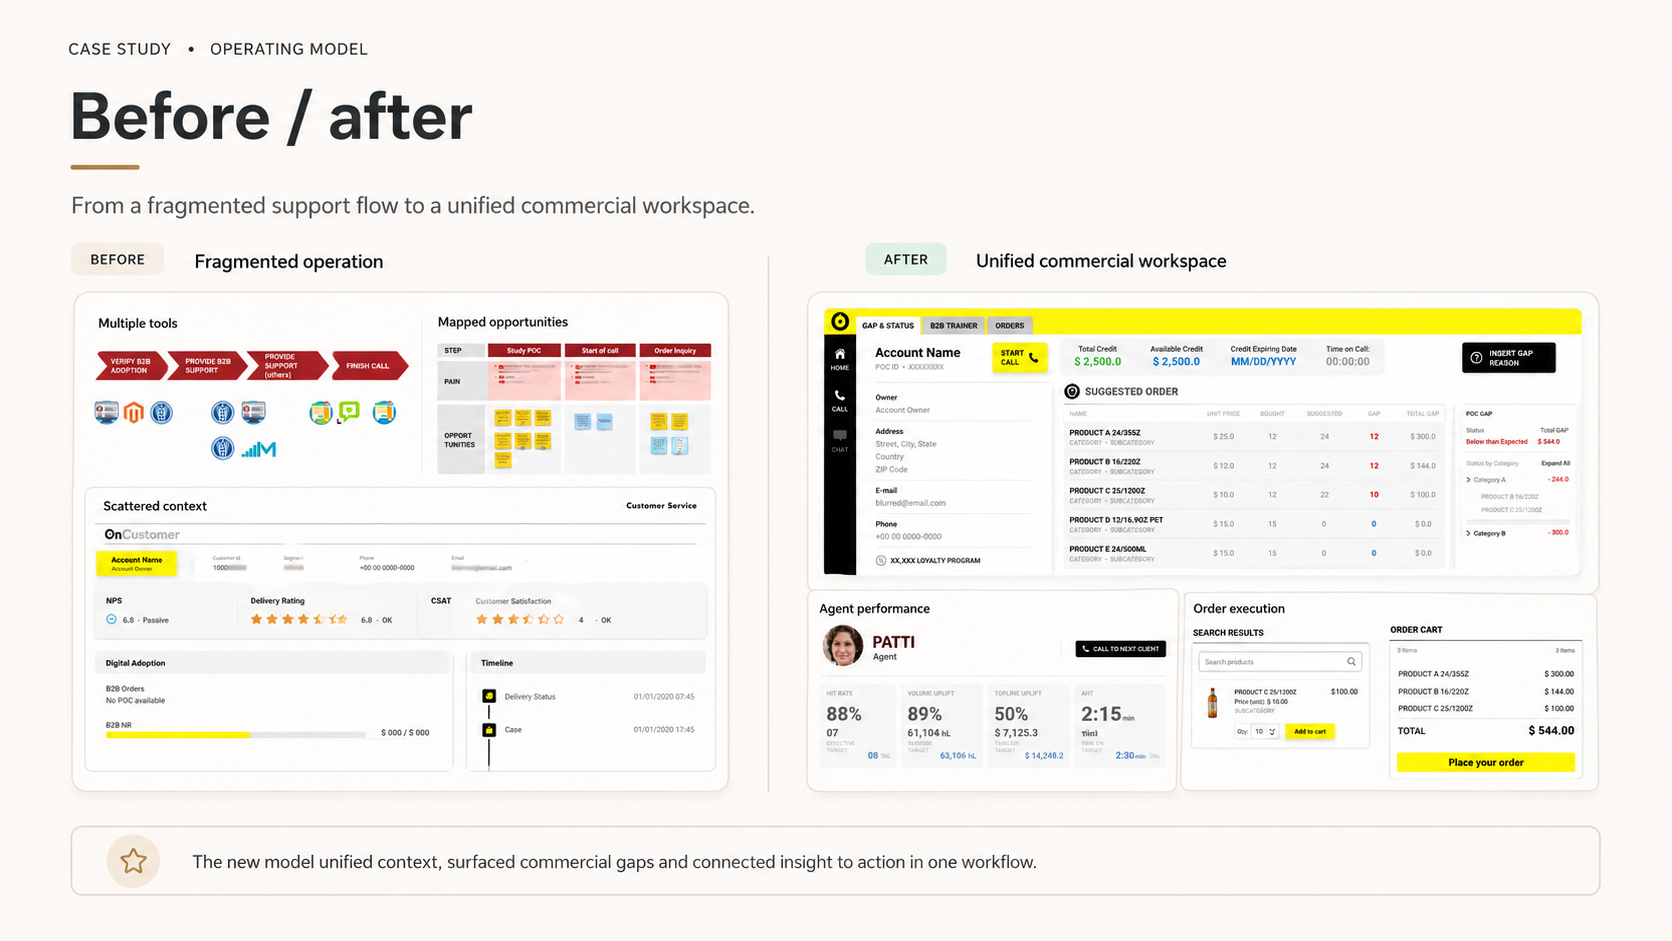
OnCustomer was built around executing transactions. Treated narrowly, the move to BEES would have ported those flows forward, carrying an experience that never helped an agent notice where revenue was leaking at a point of sale.
Intervention
I led UX direction for the OnCustomer front and translated the research findings into an agent dashboard, contextual recommendations and value-led onboarding.
Commercial problem to product model
Reframe the migration as a revenue-protection problem
The deadline was the platform transition. The brief could have stopped at feature parity.
- Evidence
- Research across markets described agents managing accounts without visibility of where performance was slipping, not agents struggling to place orders.
- Decision
- Define the target experience around revenue gaps at each point of sale rather than around order status.
- Trade-off
- A reframe during a migration competes for engineering capacity already committed to parity.
- Consequence
- The product direction changed what the platform was for, and the dashboard, recommendations and onboarding all inherited that purpose.
Connect every signal to one concrete commercial action
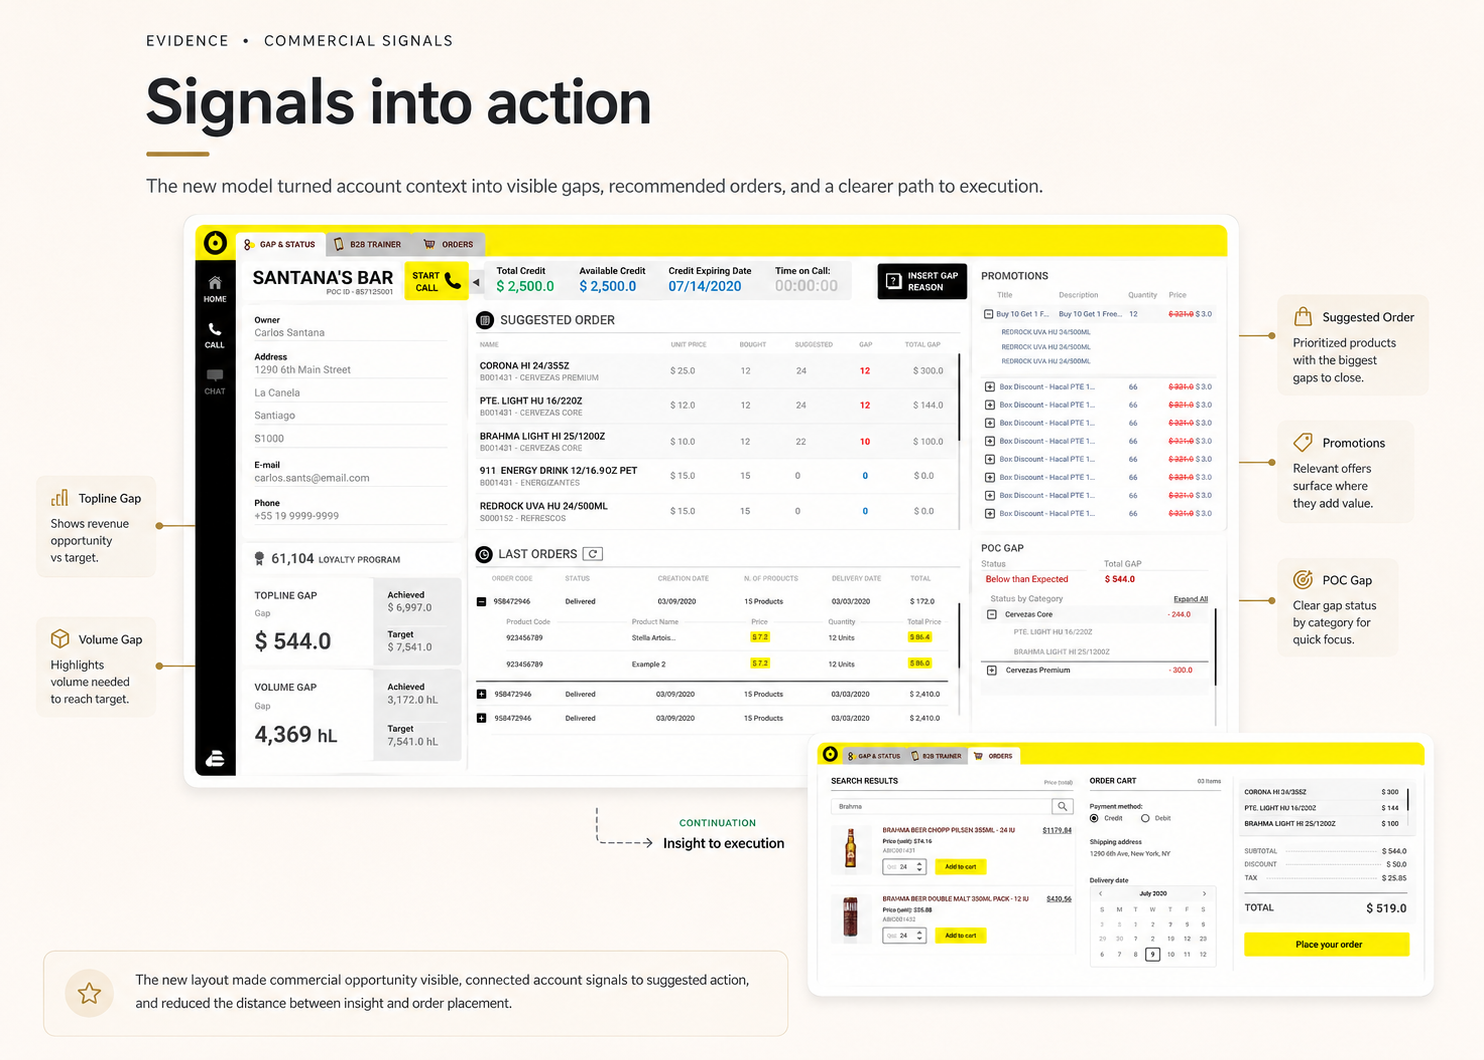
A gap view alone still leaves the agent to invent the next move.
- Evidence
- Field findings showed agents interpreting scattered information under time pressure during visits.
- Decision
- Introduce contextual recommendation cards that pair a detected signal with a specific action for that account.
- Trade-off
- Recommendations imply a promise of relevance the underlying logic has to keep.
- Consequence
- The experience became actionable at the point of contact instead of analytical after the fact.
Make the dashboard an operating surface, not a reporting screen
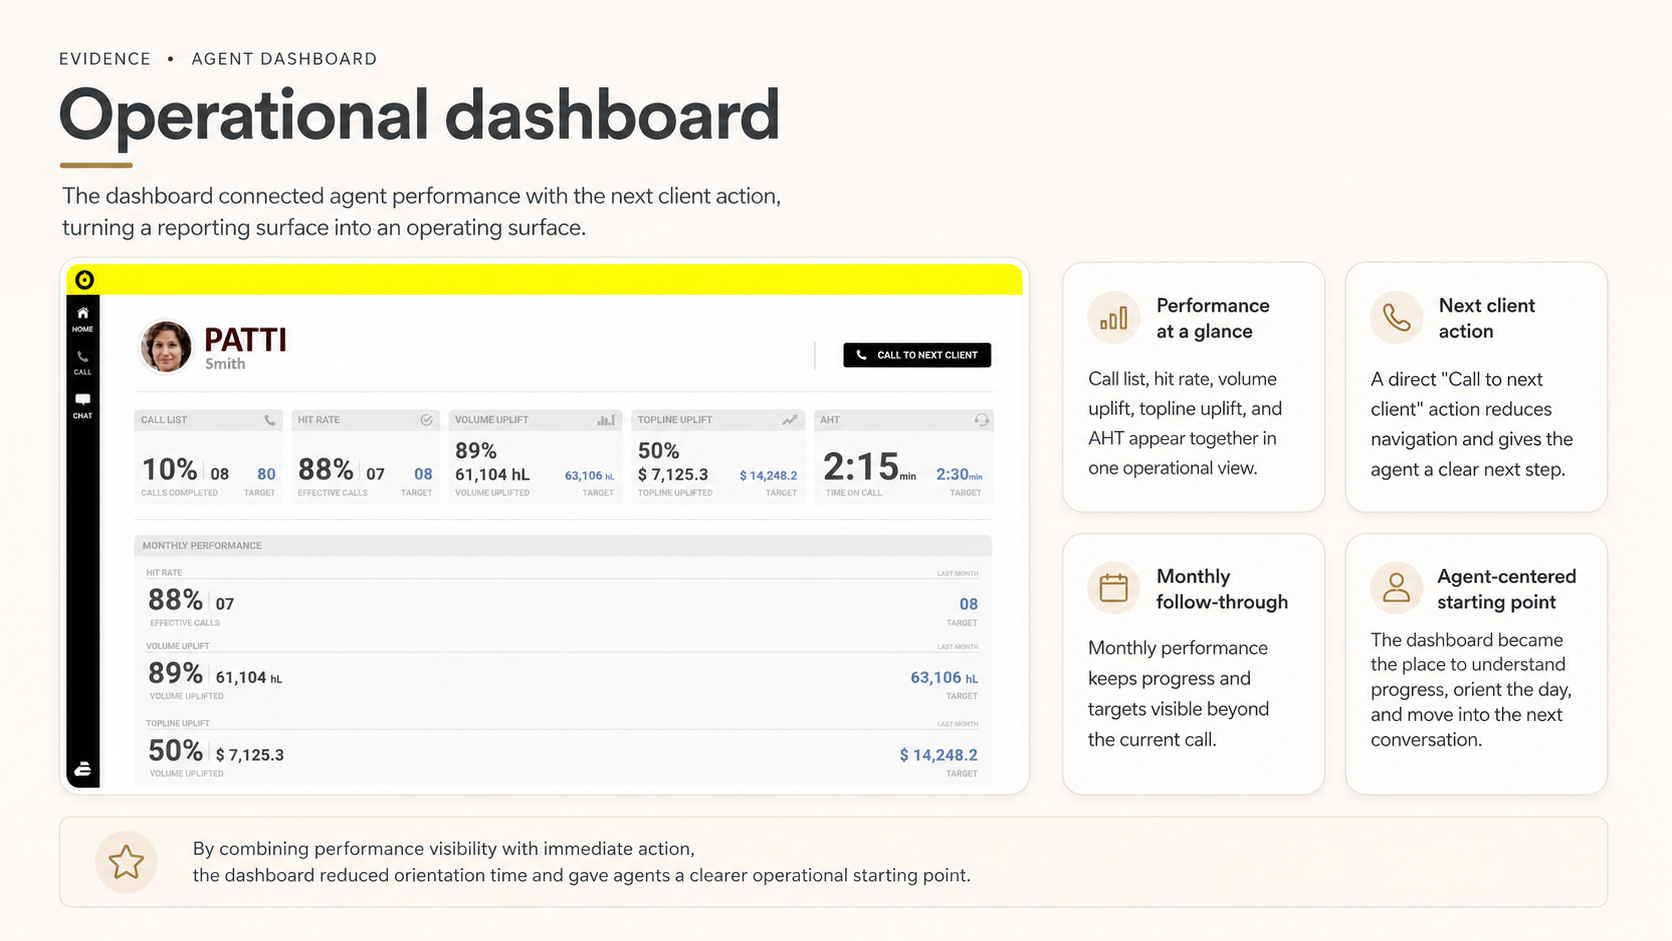
Performance data only matters if it helps the agent understand what to do next.
- Evidence
- The legacy experience scattered productivity, customer context and case work across different views and systems.
- Decision
- Connect individual performance, targets and the next client action in a single agent-centered dashboard.
- Trade-off
- Bringing performance and action together improves orientation, but increases information density and demands a strict visual hierarchy.
- Consequence
- The dashboard became the agent's starting point for understanding progress and moving into the next call.
Evidence
Constraints and trade-offs
- The internal team defined the research need, objectives and plan; fieldwork was executed by Sensorama, including the Dominican Republic materials. My contribution was translating those findings into product decisions.
- Global standards had to survive local adaptation, other products and markets had their own teams and owners.
- Participant counts and market specifics stay with the research artifact and are not used as headline proof points.
Outcome
The main risk I named was shipping direction without learning whether it changed behavior, so I helped define measurement needs and tracking direction with Product and Analytics. The direction reached production after my departure.
Delivered
- UX direction owned for a complete product front inside a global B2B platform.
- Agent dashboard, contextual recommendation cards and value-led onboarding direction.
- Global experience standards intended for adaptation across LATAM markets.
- Measurement needs and tracking direction defined with Product and Analytics.
Not measured
- Post-launch adoption, behavior change or revenue impact.
- Implementation quality after my departure.
- Authorship of the recommendation algorithm, which was not mine.
Next case
CDK Global